Auction Listings | Join Text Club | Archived Sales | Join Newsletter
Keep up with local markets throughout the year with the Farmland Trends Tracker – a free email report delivered twice a year from FCI’s state certified appraisal team.

What's happening in your local market?
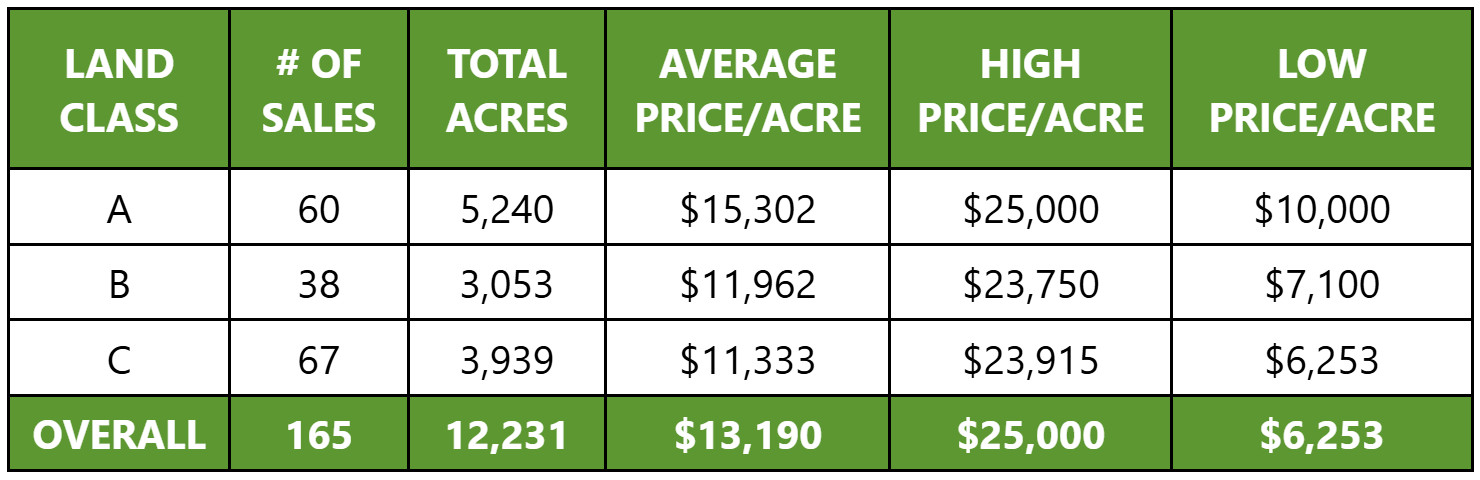
A full listing of farmland sales from June 2025 to December 2025. Land classes are based on the University of Illinois Bulletin 811 soil productivity index (PI) ratings, dividing farms into three categories: A, B, and C.
To search the table below type keywords in the search box below.
| LAND CLASS | PRICE/ACRE | # OF ACRES | SALE DATE | COUNTY |
|---|---|---|---|---|
| A | $10,000 | 80 | 7/24/2025 | Edgar |
| A | $11,500 | 45 | 8/21/2025 | Shelby |
| A | $11,600 | 130 | 11/4/2025 | Cass |
| A | $12,200 | 14 | 12/4/2025 | Vermilion |
| A | $12,505 | 56 | 12/1/2025 | Macon |
| A | $12,600 | 223 | 11/6/2025 | Vermilion |
| A | $12,800 | 82 | 11/18/2025 | Edgar |
| A | $13,000 | 62 | 12/5/2025 | Champaign |
| A | $13,300 | 88 | 11/18/2025 | Edgar |
| A | $13,400 | 79 | 6/18/2025 | Coles |
| A | $13,400 | 55 | 12/16/2025 | Montgomery |
| A | $13,450 | 60 | 11/18/2025 | Edgar |
| A | $13,488 | 22 | 12/1/2025 | Macon |
| A | $13,500 | 168 | 7/24/2025 | Edgar |
| A | $13,500 | 111 | 11/4/2025 | Edgar |
| A | $13,500 | 40 | 7/24/2025 | Edgar |
| A | $13,500 | 100 | 11/18/2025 | Edgar |
| A | $13,600 | 115 | 11/20/2025 | Clark |
| A | $13,850 | 40 | 10/22/2025 | Macon |
| A | $14,000 | 82 | 12/16/2025 | Montgomery |
| A | $14,000 | 80 | 12/16/2025 | Montgomery |
| A | $14,100 | 80 | 12/16/2025 | Montgomery |
| A | $14,100 | 161 | 11/13/2025 | Edgar |
| A | $14,400 | 80 | 7/29/2025 | Edgar |
| A | $14,400 | 82 | 7/29/2025 | Edgar |
| A | $14,500 | 101 | 11/4/2025 | Cass |
| A | $14,500 | 63 | 12/5/2025 | Champaign |
| A | $14,700 | 67 | 11/4/2025 | Cass |
| A | $15,000 | 54 | 12/8/2025 | Vermilion |
| A | $15,100 | 40 | 12/16/2025 | Montgomery |
| A | $15,100 | 40 | 12/16/2025 | Montgomery |
| A | $15,100 | 107 | 6/25/2025 | Douglas |
| A | $15,200 | 117 | 11/19/2025 | Piatt |
| A | $15,500 | 125 | 12/18/2025 | Macoupin |
| A | $15,600 | 33 | 8/15/2025 | Menard |
| A | $15,700 | 144 | 8/11/2025 | Christian |
| A | $16,000 | 59 | 12/18/2025 | Macoupin |
| A | $16,000 | 80 | 11/12/2025 | Shelby |
| A | $16,100 | 160 | 11/13/2025 | De Witt |
| A | $16,100 | 160 | 8/11/2025 | Christian |
| A | $16,100 | 80 | 11/4/2025 | Cass |
| A | $16,100 | 60 | 11/10/2025 | Montgomery |
| A | $16,200 | 40 | 6/27/2025 | McLean |
| A | $16,300 | 106 | 12/1/2025 | Christian |
| A | $16,500 | 120 | 8/21/2025 | De Witt |
| A | $16,500 | 161 | 12/18/2025 | Macoupin |
| A | $17,000 | 141 | 12/18/2025 | Macoupin |
| A | $17,100 | 40 | 12/18/2025 | Macoupin |
| A | $17,400 | 79 | 8/4/2025 | Christian |
| A | $17,400 | 83 | 8/11/2025 | Christian |
| A | $17,500 | 83 | 8/11/2025 | Christian |
| A | $17,500 | 80 | 8/4/2025 | Christian |
| A | $17,750 | 120 | 12/18/2025 | Macoupin |
| A | $18,200 | 164 | 10/6/2025 | Sangamon |
| A | $18,600 | 90 | 8/4/2025 | Christian |
| A | $18,900 | 37 | 8/4/2025 | Christian |
| A | $19,100 | 120 | 7/8/2025 | Sangamon |
| A | $19,900 | 83 | 11/19/2025 | Sangamon |
| A | $21,000 | 20 | 8/4/2025 | Christian |
| A | $25,000 | 52 | 7/19/2025 | St. Clair |
| B | $7,100 | 109 | 11/7/2025 | Coles |
| B | $7,918 | 133 | 11/13/2025 | Iroquois |
| B | $9,000 | 45 | 11/7/2025 | Coles |
| B | $9,200 | 77 | 11/10/2025 | Greene |
| B | $9,600 | 118 | 10/28/2025 | Iroquois |
| B | $9,600 | 124 | 10/2/2025 | Christian |
| B | $9,620 | 79 | 9/4/2025 | Clark |
| B | $10,000 | 40 | 7/24/2025 | Edgar |
| B | $10,200 | 64 | 8/14/2025 | McLean |
| B | $10,200 | 37 | 12/1/2025 | Edgar |
| B | $10,800 | 160 | 11/13/2025 | Iroquois |
| B | $10,900 | 71 | 8/21/2025 | Shelby |
| B | $11,105 | 74 | 8/21/2025 | Iroquois |
| B | $11,200 | 80 | 11/13/2025 | Iroquois |
| B | $11,440 | 112 | 11/13/2025 | Montgomery |
| B | $11,600 | 40 | 8/21/2025 | Shelby |
| B | $11,600 | 32 | 10/28/2025 | Iroquois |
| B | $11,800 | 134 | 12/16/2025 | Montgomery |
| B | $12,100 | 93 | 7/23/2025 | Kankakee |
| B | $12,100 | 80 | 7/24/2025 | Edgar |
| B | $12,200 | 40 | 10/28/2025 | Iroquois |
| B | $12,250 | 40 | 11/13/2025 | Iroquois |
| B | $12,584 | 236 | 12/15/2025 | Montgomery |
| B | $12,600 | 80 | 11/17/2025 | Christian |
| B | $12,800 | 80 | 11/18/2025 | Edgar |
| B | $13,250 | 40 | 11/13/2025 | Iroquois |
| B | $13,300 | 76 | 11/18/2025 | Edgar |
| B | $13,443 | 188 | 9/18/2025 | Iroquois |
| B | $13,700 | 40 | 10/30/2025 | Vermilion |
| B | $13,728 | 95 | 12/15/2025 | Montgomery |
| B | $13,832 | 26 | 12/15/2025 | Montgomery |
| B | $13,936 | 14 | 12/15/2025 | Montgomery |
| B | $14,040 | 80 | 11/13/2025 | Montgomery |
| B | $14,100 | 80 | 12/16/2025 | Montgomery |
| B | $14,144 | 38 | 11/13/2025 | Montgomery |
| B | $14,500 | 37 | 12/18/2025 | Macoupin |
| B | $17,100 | 80 | 12/18/2025 | Macoupin |
| B | $23,750 | 80 | 11/18/2025 | Clinton |
| C | $6,253 | 30 | 10/18/2025 | Clark |
| C | $6,400 | 200 | 11/7/2025 | Livingston |
| C | $6,600 | 50 | 12/16/2025 | Montgomery |
| C | $6,700 | 52 | 11/19/2025 | Clark |
| C | $6,800 | 80 | 12/4/2025 | Wayne |
| C | $6,900 | 60 | 11/6/2025 | Coles |
| C | $7,350 | 240 | 6/12/2025 | Wayne |
| C | $7,400 | 40 | 7/24/2025 | Edgar |
| C | $7,700 | 20 | 11/10/2025 | Richland |
| C | $7,900 | 80 | 7/24/2025 | Edgar |
| C | $7,900 | 100 | 10/22/2025 | Coles |
| C | $7,900 | 40 | 11/12/2025 | Fayette |
| C | $8,000 | 81 | 12/2/2025 | Randolph |
| C | $8,000 | 40 | 12/2/2025 | Jasper |
| C | $8,001 | 23 | 12/2/2025 | Randolph |
| C | $8,375 | 50 | 8/26/2025 | Bond |
| C | $8,550 | 97 | 11/17/2025 | Jasper |
| C | $8,650 | 63 | 11/18/2025 | Edgar |
| C | $8,825 | 40 | 6/26/2025 | Cumberland |
| C | $9,000 | 20 | 11/19/2025 | Clark |
| C | $9,500 | 62 | 12/16/2025 | Montgomery |
| C | $9,900 | 44 | 12/1/2025 | Washington |
| C | $9,925 | 35 | 9/16/2025 | Effingham |
| C | $10,000 | 36 | 8/26/2025 | Bond |
| C | $10,000 | 15 | 11/10/2025 | Richland |
| C | $10,000 | 100 | 11/12/2025 | Fayette |
| C | $10,125 | 20 | 12/10/2025 | Jasper |
| C | $10,494 | 40 | 11/7/2025 | Jasper |
| C | $10,525 | 40 | 12/1/2025 | Washington |
| C | $11,200 | 119 | 11/20/2025 | Clark |
| C | $11,500 | 51 | 12/16/2025 | Montgomery |
| C | $11,500 | 35 | 11/10/2025 | Richland |
| C | $12,000 | 27 | 10/22/2025 | Macoupin |
| C | $12,000 | 37 | 10/22/2025 | Macoupin |
| C | $12,100 | 40 | 12/2/2025 | Jasper |
| C | $12,342 | 117 | 9/16/2025 | Shelby |
| C | $12,400 | 81 | 9/4/2025 | Edgar |
| C | $12,500 | 89 | 11/19/2025 | Fayette |
| C | $12,600 | 13 | 12/2/2025 | Jasper |
| C | $12,700 | 67 | 12/16/2025 | Montgomery |
| C | $12,720 | 80 | 11/7/2025 | Jasper |
| C | $12,900 | 27 | 10/22/2025 | Macoupin |
| C | $13,000 | 22 | 11/6/2025 | Jasper |
| C | $13,065 | 24 | 10/22/2025 | Clinton |
| C | $13,100 | 35 | 11/10/2025 | Richland |
| C | $13,127 | 26 | 11/12/2025 | Bond |
| C | $13,226 | 80 | 11/19/2025 | Bond |
| C | $13,233 | 15 | 9/10/2025 | Effingham |
| C | $13,241 | 38 | 12/4/2025 | Clinton |
| C | $13,416 | 117 | 11/13/2025 | Montgomery |
| C | $13,473 | 80 | 9/4/2025 | Edgar |
| C | $14,025 | 40 | 12/1/2025 | Washington |
| C | $14,049 | 41 | 9/22/2025 | Gallatin |
| C | $14,181 | 48 | 10/29/2025 | St. Clair |
| C | $14,750 | 45 | 12/9/2025 | St. Clair |
| C | $14,750 | 60 | 12/9/2025 | St. Clair |
| C | $14,750 | 157 | 11/20/2025 | Bond |
| C | $15,050 | 62 | 11/6/2025 | Jasper |
| C | $15,500 | 27 | 9/4/2025 | Edgar |
| C | $15,500 | 45 | 9/4/2025 | Edgar |
| C | $15,960 | 39 | 11/30/2025 | Madison |
| C | $16,116 | 160 | 7/31/2025 | Madison |
| C | $16,250 | 24 | 7/29/2025 | Edwards |
| C | $16,550 | 41 | 11/14/2025 | Clinton |
| C | $18,911 | 18 | 11/25/2025 | St. Clair |
| C | $21,178 | 73 | 12/9/2025 | Clinton |
| C | $23,915 | 41 | 12/9/2025 | Clinton |
Farmland Average Decreases in 2025
According to Farm Credit Illinois’ annual benchmark study, farmland values in the central and southern 60 counties of Illinois decreased for the first time since 2018. On average, the benchmarks were down 4.41% across the territory.
Read the full 2025 farmland value benchmark study report
Sign Up For Trends Tracker