Keep up with local markets throughout the year with the Farmland Trends Tracker – a free email report delivered twice a year from FCI’s state certified appraisal team.
Archived Farmland Trends Tracker Reports
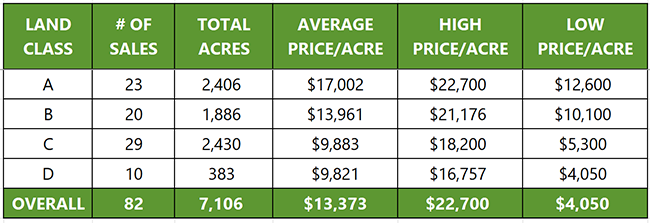
A summary of land sales from Feb. 1, 2023 to Jul. 31, 2023
To search the table below type keywords in the search box below.
| LAND CLASS | PRICE/ACRE | # OF ACRES | SALE DATE | COUNTY |
|---|---|---|---|---|
| D | $10,075 | 40 | 2/7/2023 | Bond |
| A | $21,100 | 200 | 3/28/2023 | Cass |
| A | $17,100 | 161 | 3/28/2023 | Cass |
| A | $17,100 | 74 | 3/28/2023 | Cass |
| A | $20,100 | 70 | 3/28/2023 | Champaign |
| A | $15,400 | 146 | 6/14/2023 | Champaign |
| B | $12,240 | 63 | 2/19/2023 | Champaign |
| B | $12,200 | 239 | 3/21/2023 | Champaign |
| C | $14,100 | 40 | 4/10/2023 | Clark |
| C | $17,000 | 40 | 3/16/2023 | Clinton |
| C | $16,691 | 21 | 3/16/2023 | Clinton |
| B | $16,500 | 194 | 2/7/2023 | Coles |
| B | $14,400 | 35 | 3/29/2023 | Coles |
| B | $13,200 | 80 | 3/29/2023 | Coles |
| C | $5,300 | 99 | 3/29/2023 | Coles |
| D | $16,757 | 33 | 2/21/2023 | Cumberland |
| D | $13,331 | 43 | 2/21/2023 | Cumberland |
| A | $15,163 | 79 | 4/11/2023 | Edgar |
| C | $12,000 | 40 | 3/24/2023 | Edwards |
| C | $16,713 | 50 | 2/21/2023 | Effingham |
| C | $13,804 | 20 | 2/21/2023 | Effingham |
| C | $12,125 | 20 | 2/20/2023 | Fayette |
| C | $9,555 | 68 | 1/18/2023 | Fayette |
| C | $9,432 | 39 | 1/18/2023 | Fayette |
| C | $8,500 | 24 | 4/24/2023 | Fayette |
| C | $7,548 | 520 | 3/2/2023 | Fayette |
| C | $5,630 | 40 | 3/23/2023 | Fayette |
| D | $9,255 | 49 | 5/1/2023 | Fayette |
| D | $7,626 | 55 | 1/18/2023 | Fayette |
| D | $4,050 | 30 | 2/20/2023 | Fayette |
| A | $14,600 | 68 | 6/27/2023 | Iroquois |
| B | $17,200 | 110 | 7/12/2023 | Iroquois |
| B | $13,354 | 164 | 7/12/2023 | Iroquois |
| B | $13,100 | 81 | 7/12/2023 | Iroquois |
| C | $18,200 | 79 | 3/9/2023 | Jasper |
| C | $18,200 | 40 | 3/9/2023 | Jasper |
| C | $10,600 | 50 | 2/23/2023 | Jasper |
| C | $8,850 | 52 | 1/6/2023 | Jefferson |
| C | $7,594 | 94 | 4/3/2023 | Jefferson |
| C | $6,218 | 91 | 6/6/2023 | Jefferson |
| D | $4,900 | 34 | 6/6/2023 | Jefferson |
| A | $16,250 | 39 | 3/18/2023 | Jersey |
| A | $14,000 | 35 | 3/18/2023 | Jersey |
| C | $10,250 | 64 | 3/18/2023 | Jersey |
| B | $18,000 | 80 | 6/8/2023 | Lawrence |
| B | $12,500 | 94 | 6/8/2023 | Lawrence |
| A | $15,351 | 19 | 2/23/2023 | Macoupin |
| A | $15,198 | 106 | 2/23/2023 | Macoupin |
| A | $13,900 | 80 | 3/7/2023 | Macoupin |
| B | $15,400 | 90 | 3/2/2023 | Macoupin |
| C | $10,316 | 47 | 5/22/2023 | Madison |
| C | $6,800 | 180 | 6/2/2023 | Marion |
| A | $12,600 | 183 | 2/14/2023 | Menard |
| B | $15,797 | 76 | 2/21/2023 | Montgomery |
| C | $10,505 | 104 | 2/24/2023 | Montgomery |
| A | $19,600 | 140 | 3/10/2023 | Morgan |
| A | $18,000 | 161 | 3/14/2023 | Morgan |
| A | $15,700 | 159 | 1/24/2023 | Morgan |
| B | $15,700 | 88 | 4/18/2023 | Morgan |
| B | $15,300 | 50 | 3/9/2023 | Morgan |
| B | $13,100 | 80 | 1/24/2023 | Morgan |
| A | $20,600 | 82 | 7/20/2023 | Moultrie |
| C | $8,000 | 40 | 5/16/2023 | Perry |
| C | $5,568 | 88 | 6/29/2023 | Pulaski |
| A | $22,700 | 40 | 4/18/2023 | Sangamon |
| A | $20,100 | 79 | 4/18/2023 | Sangamon |
| A | $20,100 | 29 | 4/18/2023 | Sangamon |
| B | $12,600 | 93 | 3/9/2023 | Shelby |
| A | $17,600 | 204 | 3/2/2023 | St. Clair |
| B | $21,176 | 34 | 3/7/2023 | St. Clair |
| C | $15,081 | 75 | 3/20/2023 | St. Clair |
| C | $14,082 | 58 | 3/7/2023 | St. Clair |
| D | $11,940 | 19 | 3/20/2023 | St. Clair |
| A | $17,764 | 101 | 3/7/2023 | Vermilion |
| A | $13,836 | 152 | 3/7/2023 | Vermilion |
| B | $10,600 | 80 | 2/21/2023 | Vermilion |
| B | $10,600 | 77 | 2/21/2023 | Vermilion |
| B | $10,100 | 78 | 2/21/2023 | Vermilion |
| C | $11,700 | 247 | 4/13/2023 | Washington |
| C | $11,525 | 99 | 1/13/2023 | Washington |
| D | $13,000 | 40 | 6/8/2023 | Washington |
| D | $8,125 | 40 | 7/19/2023 | Wayne |
Farmland Value Benchmark Study
Values Inch Even Higher in 2023
According to Farm Credit Illinois’ annual benchmark study, farmland values in the central and southern 60 counties of Illinois increased for the fifth consecutive year. On average, the benchmarks were up 8.1%. While this sets a new peak for the study, 2023 values increased more moderately than reported in 2022.
"Farmland in 2023 continues displaying its strength despite rising interest costs. A new peak in the market was set once again, influenced by profitable commodity prices, constant demand coupled with limited supply of farmland, and stabilized balance sheets on many farms." - Kent Reid, Farm Credit Illinois chief appraiser
Read the full 2023 farmland value benchmark study reportSign Up For Trends Tracker