
Farmland Averages Stable in 2026

-
 August 31, 2026
Each year the Farm Credit Illinois (FCI) appraisal team evaluates the same 22 benchmark farms throughout its 60-county territory based on the land’s productive index (PI) rating, as calculated by the University of Illinois’ Bulletin 811. Based on individual PI ratings, farms are divided into four categories: 1A, 2B, 3C Central, and 3C South. The study compares July 1 values from year-to-year.
Farmland Averages Stable in 2026
According to Farm Credit Illinois’ annual benchmark study, farmland values in the central and southern 60 counties of Illinois indicate a stable farmland market. Overall, the benchmark farms recorded no year-over-year change in value across the territory.
As seen in Figure 1, land values had a dramatic run-up beginning in 2003 until peaking in 2014. The first decline in more than a decade began in 2015, continuing a slight decline through 2018. Land values increased again for six consecutive years and set new highs in 2024 before a slight decline in 2025.
Figure 1
Benchmark Averages as of July 1, 2000-2026
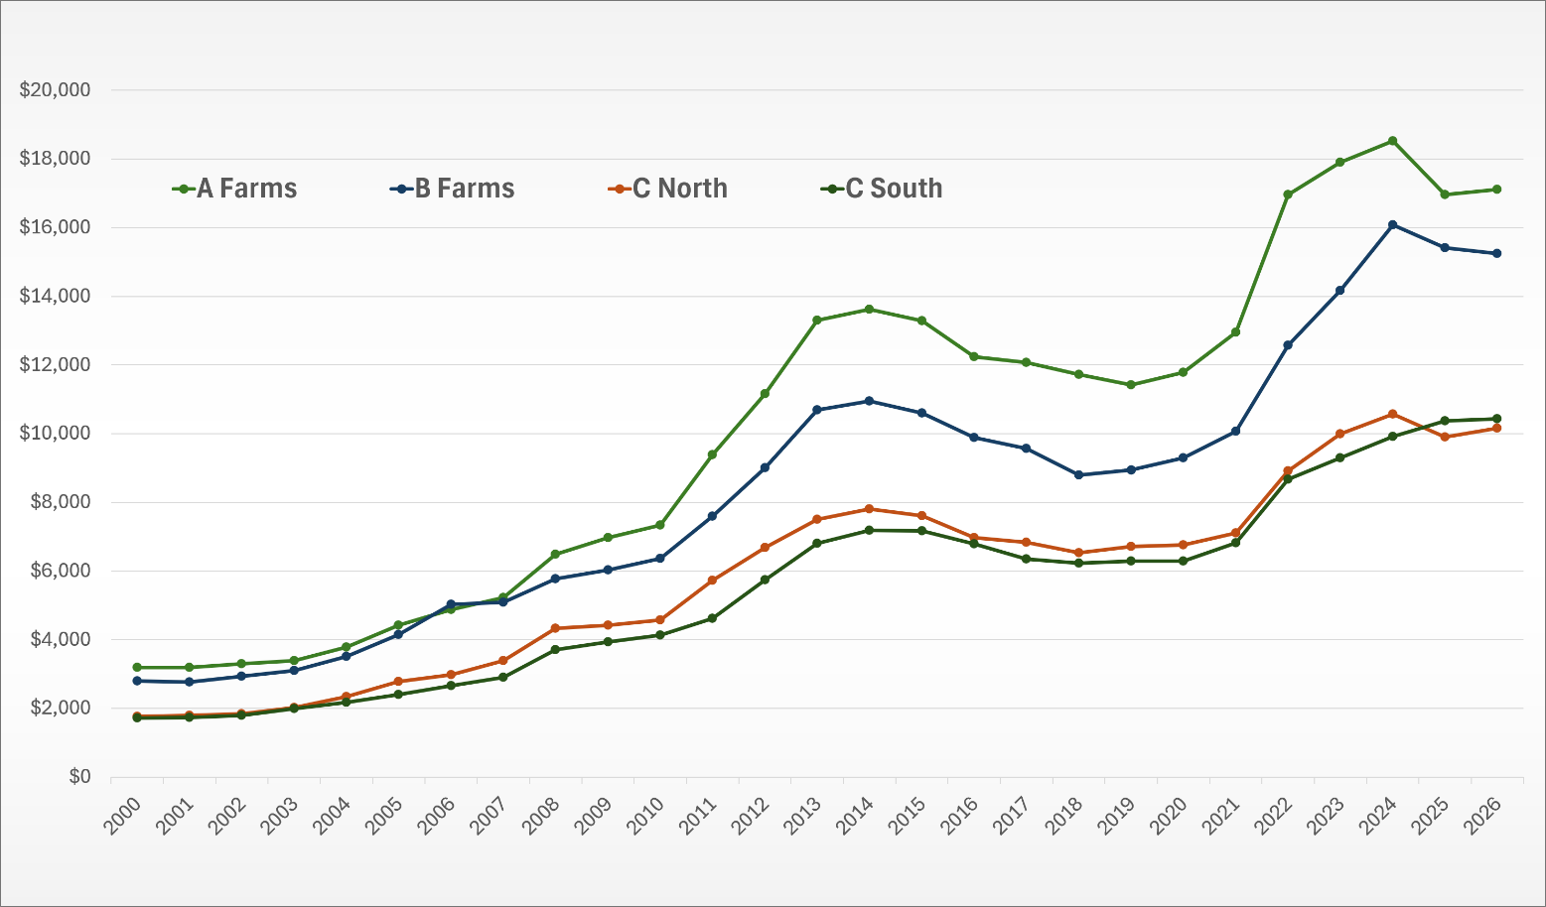
Figure 1: FCI’s average benchmark study results by land class on July 1, 2000-2026. Source: FCI 2026 Farmland Value Benchmark Study
The 2026 results indicate a stable farmland market overall. Of the 22 benchmark farms analyzed, seven decreased in value, seven increased, and eight reflected no change. In aggregate, the benchmark farms reflected no overall change in value from the prior year.
Results across all land classes showed considerable variation, reinforcing that agricultural real estate is a location-specific asset. When considering the individual benchmark values, the year-over-year percentage changes ranged from -8.22% to 12.5%.
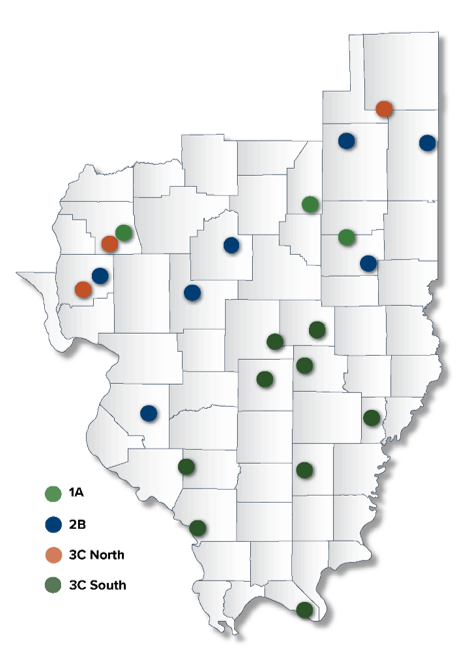
Table 1 illustrates the average changes in the four general land classifications. Class 1A and 2B benchmark farms are mostly located in the northern part of FCI territory, whereas Class 3C farms are throughout the territory. These farms are tracked separately based upon location. Benchmark farms are plotted and categorized by land class on the map in Figure 1.
Table 1

Commodity Prices in Relation to Land Values
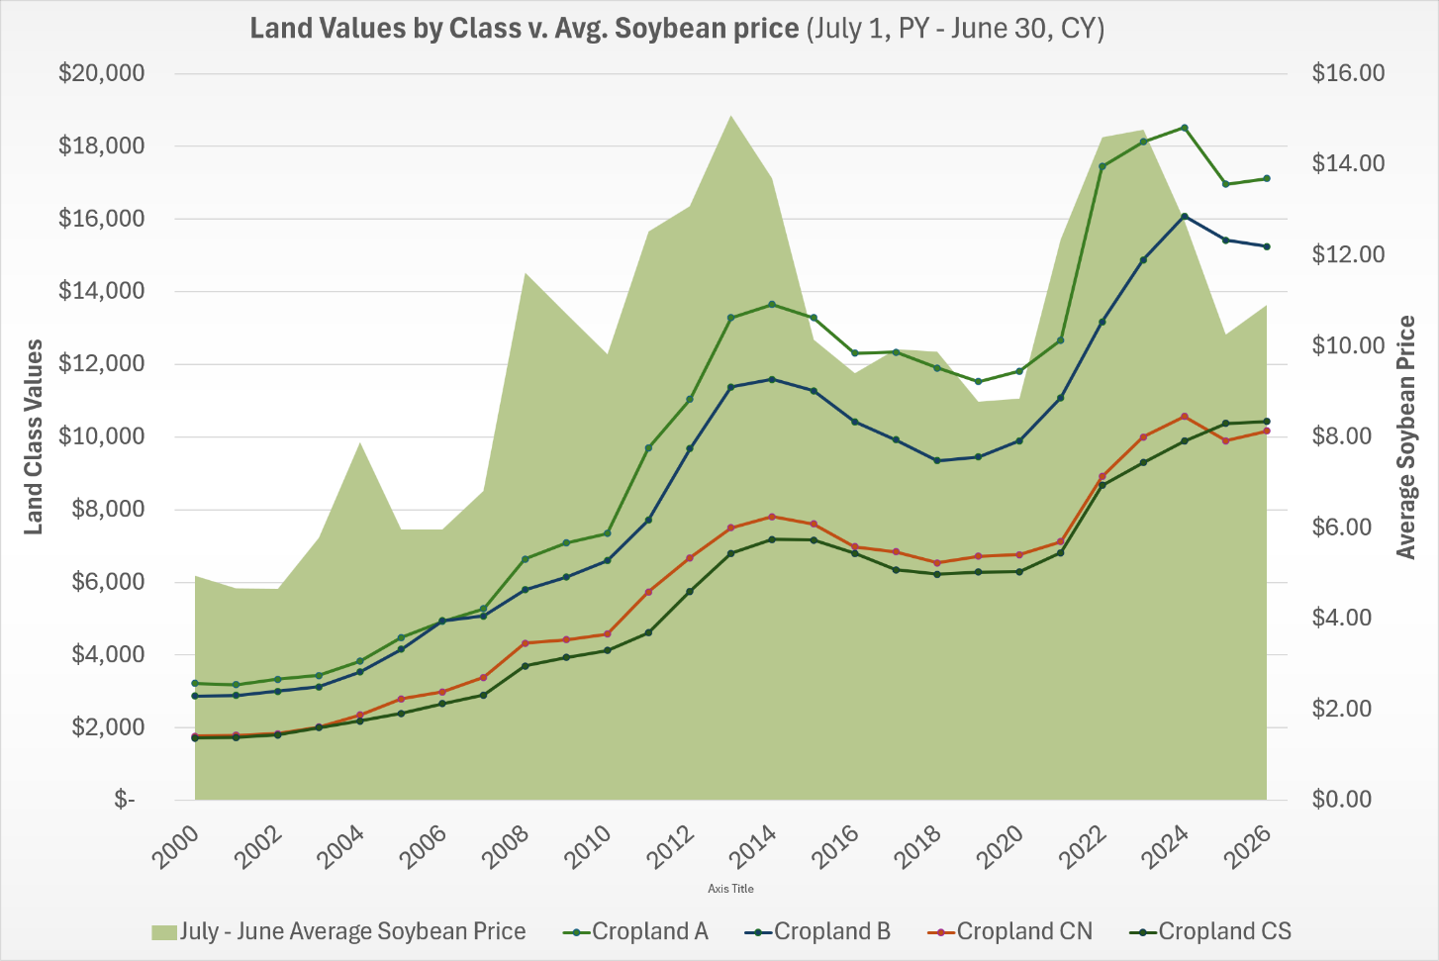
Commodity prices began declining during the second half of 2023, contributing to reduced net farm income for the 2024 and 2025 crop years. Although prices have improved modestly, profit margins remain constrained, which may place downward pressure on land values in the coming year.
Figures 2 and 3 demonstrate the relationship between land values and corn and soybean prices.
Figure 2
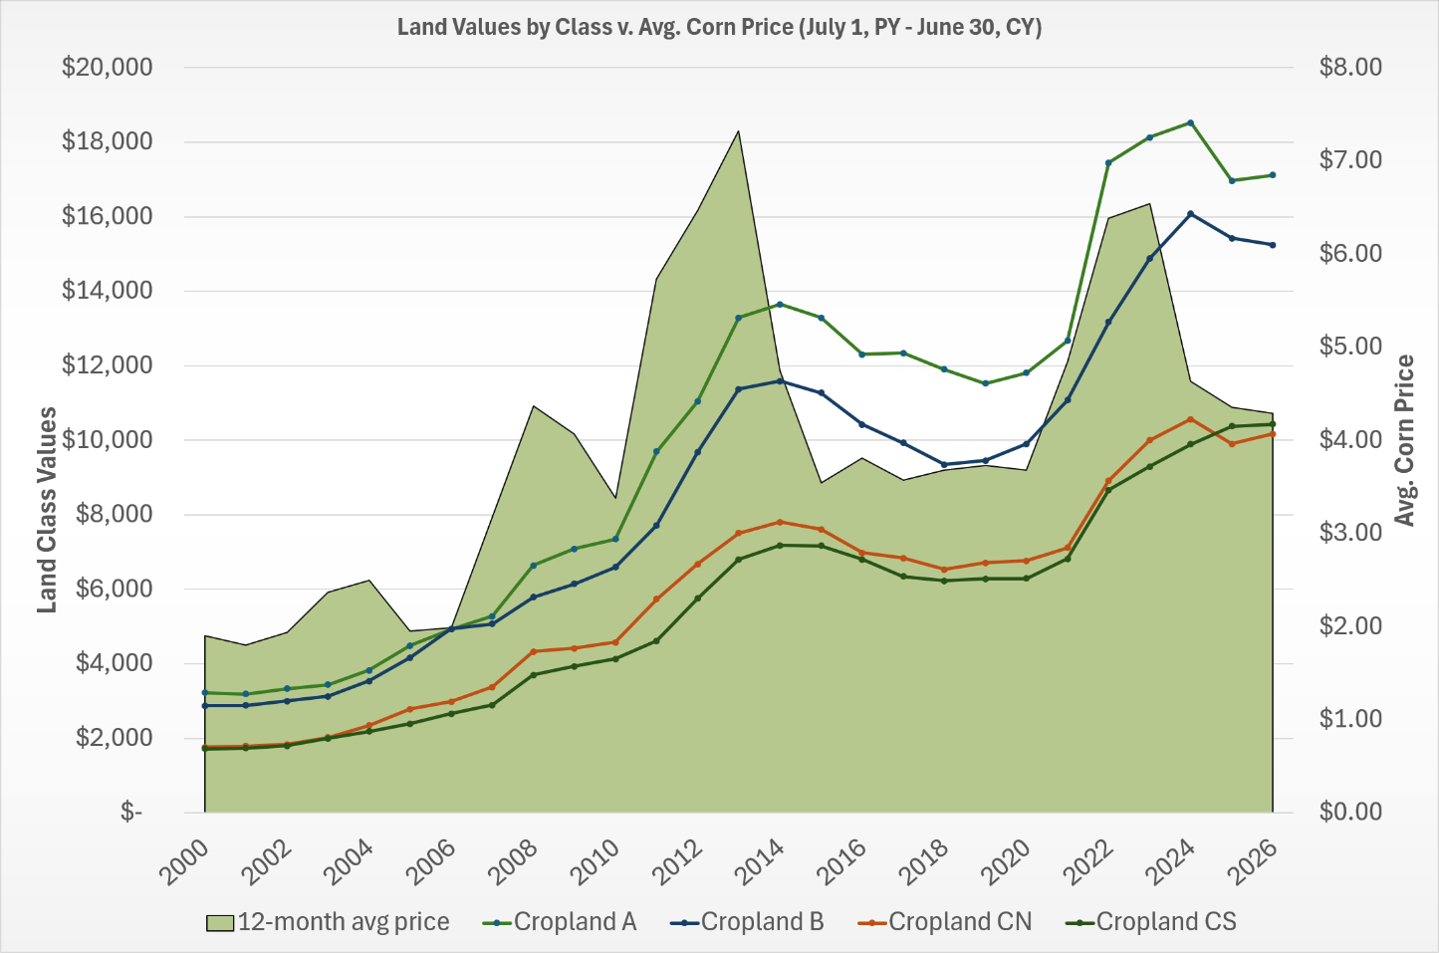 Figure 3
Other Factors Affecting Land Values
While some market activity occurred during the past winter and early spring, overall transaction volume was below typical historical levels. In general, demand for Illinois farmland continues to exceed available supply. Buyers are primarily a mix of operating farmers, retired farmers, and local farmland investors.
The agricultural economy within the Farm Credit Illinois territory has shown signs of softening. Lower commodity prices and elevated interest rates have reduced net farm income over the past few years and placed additional pressure on producers’ working capital.
Crop conditions across the FCI territory remain mixed. Overall, northern and central portions of the territory are reporting stronger conditions than the southern portion of the state. As of this writing, USDA reported Illinois corn conditions at 13% Excellent, 48% Good, 28% Fair, 8% Poor, and 3% Very Poor. Soybean conditions were rated 12% Excellent, 47% Good, 32% Fair, 7% Poor, and 3% Very Poor.
Cash Rental Trends
Cash rents increased over the past several years before stabilizing in 2024. Lower commodity prices and net farm income contributed to a modest decline in cash rents for the 2025 crop year. Overall cash rents were generally unchanged in 2026, and continued pressure within the agricultural economy may limit upward movement in the near term. Historically, changes in cash rents lag behind corresponding changes in farmland values.
Table 2
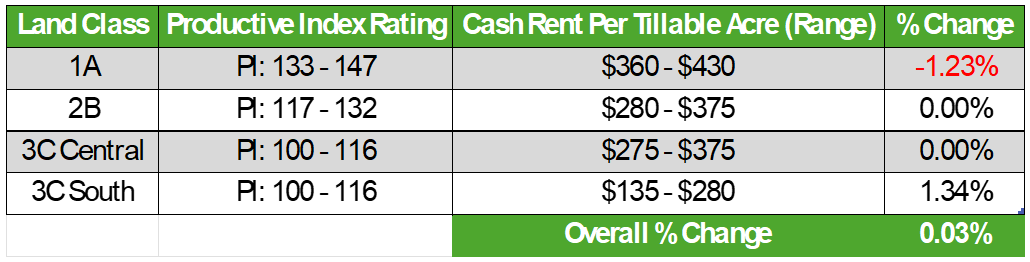 Table 2: Average percent change in overall cash rent since 2025 by land class. Source: FCI 2026 Farmland Value Benchmark Study
Summary
The 2026 Benchmark Update indicates a stable farmland market across the Farm Credit Illinois territory. Overall benchmark values were unchanged from the prior year. Of the 22 benchmark farms analyzed, seven decreased in value, seven increased, and eight reflected no change. Although average values were stable, the range of individual benchmark changes continues to demonstrate the location-specific nature of agricultural real estate values.
Market fundamentals remain mixed. Lower commodity prices, elevated interest rates, higher input and machinery costs, and reduced net farm income have continued to pressure producer margins and working capital. At the same time, demand for quality farmland remains solid, even while the available supply of land for sale is moderate and generally below historical levels.
-
Tag Cloud
FFA balance sheet cash flow patronage Land Values Directors Cup Land Classes Weather appraisals Financials farmland auctions Farm Credit College Auction Results FOMC 4-H rural marketplace investment Calendar contest Farm Interest Rates Community Improvement Grants FreshRoots land sales Essentials Newsletter Education Weather Outlook employees security
