Farmland Value Benchmark Study Results

-
 August 6, 2020
 Featured
Each year the Farm Credit Illinois (FCI) appraisal team evaluates the same 20 benchmark farms throughout its 60-county territory based on the land’s productive index (PI) rating, as calculated by the University of Illinois’ Bulletin 811. Based on individual PI ratings, farms are divided into four categories: 1A, 2B, 3C Central, and 3C South.
Results Show Stable Land Values
Overall land values in the central and southern 60 counties of Illinois increased slightly for the second consecutive year, according to the annual benchmark study.
As seen in Figure 1, land values had a dramatic run-up beginning in 2003, until the peak in 2014. Results began their first decline in more than a decade in 2015 with an average decrease in value of 1.51%.
Benchmark Averages as of July 1, 2000 - 2020
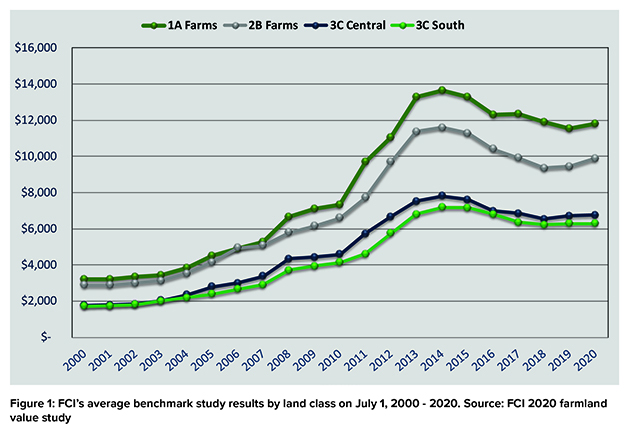
The 2020 study showed an increase of 2.07% – a resilient and generally stable land market. Five of 20 benchmark farms decreased in value moderately, 12 slightly increased, and three were unchanged.
Results across land classes showed considerable variation, reinforcing the fact that agricultural real estate is a location-specific asset. When considering the benchmarks individually, the year-over-year percentage changes ranged from –3.93 to +7.20%.
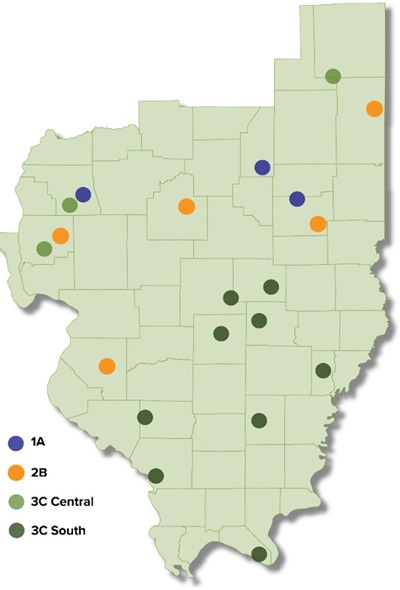
As illustrated in the table below, average changes in the four land classes varied. Class 1A and 2B benchmark farms are mostly located in central Illinois. Class 3C farms are located in both central and southern Illinois and are tracked separately. Benchmark farms are plotted and categorized by land class on the map to the left.
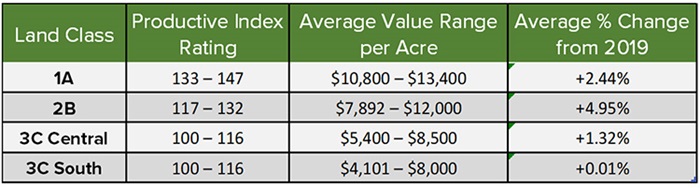
Table 1: Average percent change in overall value since 2018 by land class. Source: FCI 2019 farmland value benchmark study
Commodity Prices in Relation to Land Values
Just as higher commodity prices helped fuel the dramatic increase in land values, lower commodity prices have softened them. However, the decline in values has not been as rapid as historic trends would suggest primarily due to the limited supply of available land. Figures 2 and 3 demonstrate the relationship between land values and corn and soybean prices.
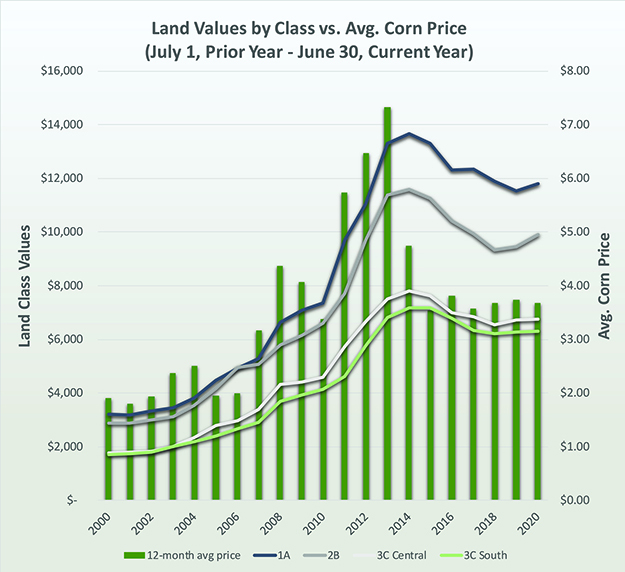
Figure 2
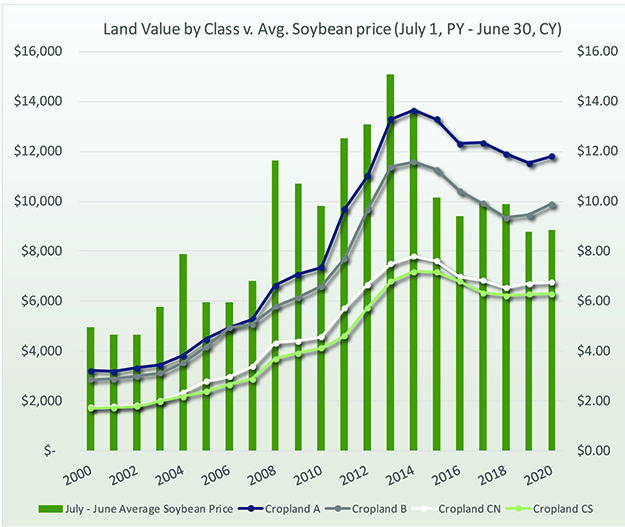
Figure 2 and 3: Average corn and soybean price in relation to FCI annual benchmark study results by land class annually on July 1, 2000-2010. Sources: Macrotrends.net and FCI 2020 farmland vaue benchmark study
Other Factors Affecting Land Values
Demand for Illinois farmland remains steady due to a limited supply of farms for sale. Buyers are primarily a mix of operating and retired farmers and experienced farmland investors with ties to the area.
The number of farmland transactions in the FCI territory moderated in the second quarter of 2020, following the state’s coronavirus stay-at-home order. Even before event restrictions, supply remained limited.
Above-trend yields and Market Facilitation Payments – along with coronavirus assistance programs from the federal government – have supplemented net farm incomes, which have been stressed due to sustained lower commodity prices and trade agreement issues.
The full ramifications from the pandemic are yet-to-be-seen but will undoubtedly impact agriculture. Ethanol producers continue struggling with reduced demand due to COVID-19. If overall economic recovery is slow, commodity demand for could be affected in 2021.
Crop conditions throughout the FCI territory are mostly positive. Illinois corn conditions reported Aug. 3, 2020, by the USDA show 17% Excellent, 59% Good, 19% Fair, 4% Poor, and 1% Very Poor. Soybeans are rated at 15% Excellent, 61% Good, 18% Fair, 4% Poor, and 2% Very Poor.
Attempting to contain the economic fallout caused by COVID-19, the Federal Reserve reduced the federal funds rate to nearly zero in March. Historic low interest rates should serve as a positive for the coming year.
Cash Rental Trends
Cash rents have declined slightly overall for the past few years, following lower commodity prices.
As illustrated in the table below, average changes to cash rent in the four land classes varied. The 2020 cash rents were down for 1A and 2B farms and remained unchanged for 3C Central and 3C South farms. Overall, cash rents were stable.
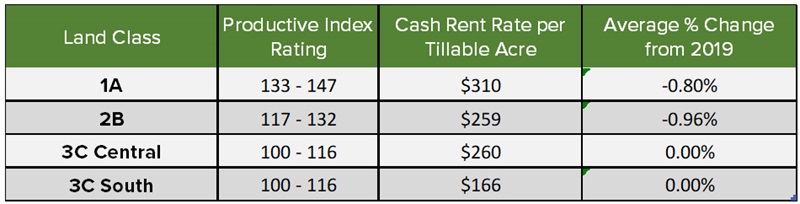
Table 2: Average percent change in overall cash rent since 2019 by land class. Source: FCI 2020 farmland value benchmark study
Summary
The 2020 benchmark update for the Farm Credit Illinois territory shows a resilient and generally stable land market. The variations reinforce the fact that agricultural land is a location specific asset. Five of the 20 benchmarks did show a small decline while 12 were slightly higher. Overall, an increase of 2.07% indicates a steady market throughout FCI’s 60-county territory.
The economic health of farmers and farm owners is mostly stable, but there still is pressure on farmers’ financial positions. As the territory deals with moderate-to-low commodity prices, trade issues, and the unknown future effects of COVID-19, expectations are for farmland values to decline moderately in the next year.
-
Tag Cloud
4-H Land Values Farm Credit College appraisals FOMC Land Classes Education rural marketplace investment Calendar contest Community Improvement Grants farmland auctions Weather Outlook Financials FreshRoots Auction Results Interest Rates liquidity Weather patronage Focus on Farming calendar cash flow land sales Farm Essentials Newsletter FFA security