How Government Debt and Fed Balance Sheets Impact Your Farm

-
 June 3, 2021
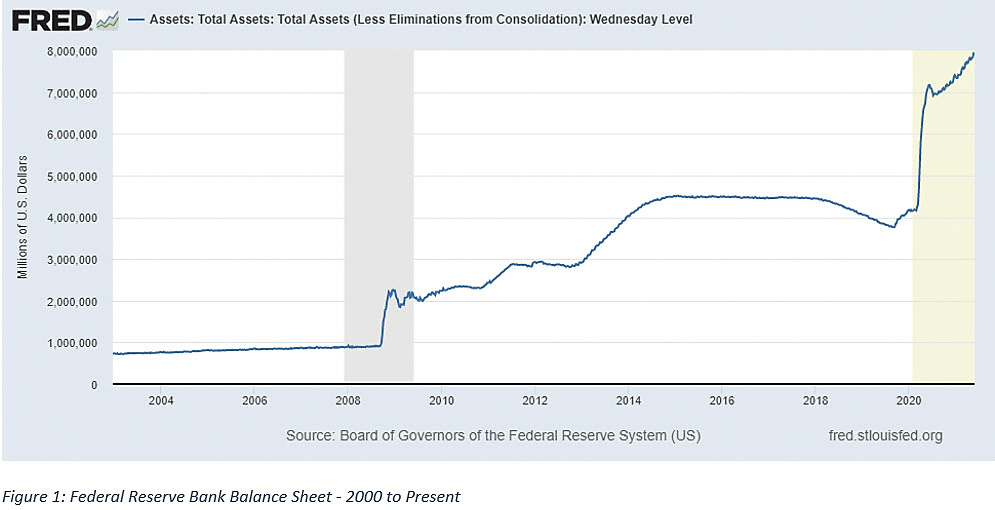
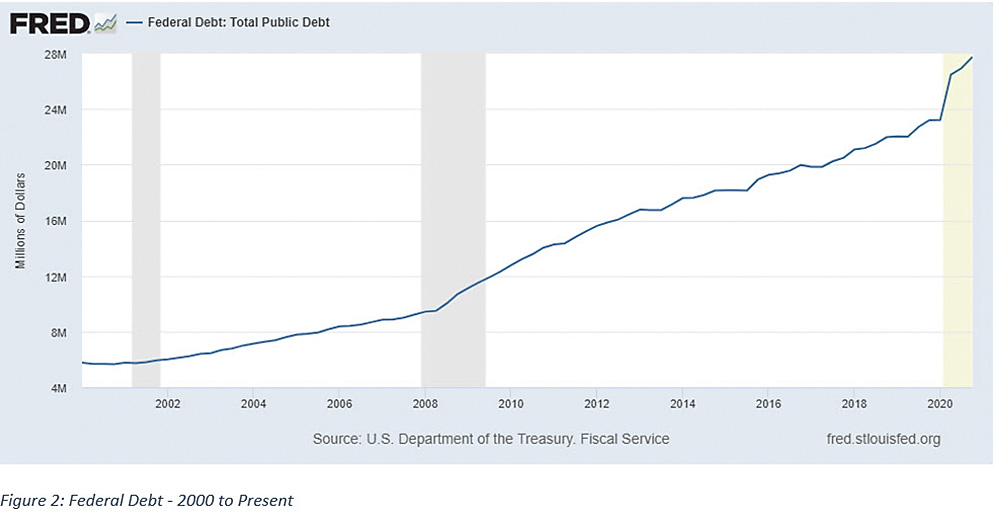
The FOMC also voted to continue monthly purchases of at least $80 billion of U.S. Treasuries and at least $40 billion of agency mortgage-backed securities in addition to reinvesting maturing securities. These purchases will continue increasing the Fed’s balance sheet. They also absorb a large portion of the new debt being issued by the Treasury Department as a result of the large federal government budget deficit – which has grown especially over the past 15 months. The Fed’s balance sheet has tripled in size since the beginning of the pandemic in early 2020 and the federal debt is now more than $28 trillion, as seen in Figures 1 and 2 below. The Fed now owns nearly 35% of the publicly held federal debt.
The most recent FOMC projections show no Fed Funds rate increase until at least 2023. Only seven of the 18 members project any Fed Funds rate increases in 2023. The Fed will provide updated projections at their upcoming meeting June 15-16.
All actions were unanimously approved by the voting members of the FOMC.
Market reaction was surprisingly calm, with longer-term Treasury yields declining somewhat in the days leading up to and following the meeting. The bond market appears to have been reassured that recent inflationary fears are overblown, and the Fed Funds futures market doesn’t project a significant chance of a rate increase until at least 2022.
A Bolstered Budget Deficit, Federal Debt, and Federal Reserve Balance Sheet: What Could Go Wrong?
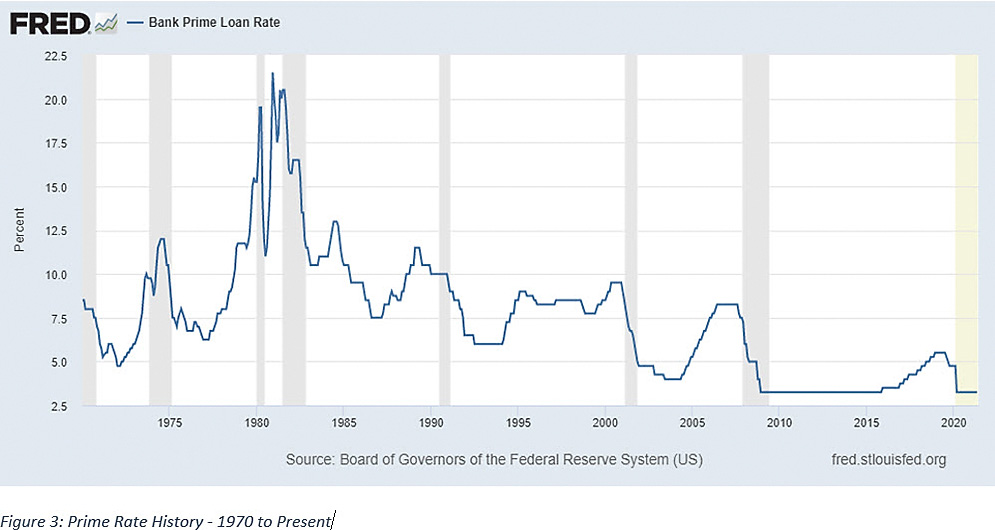
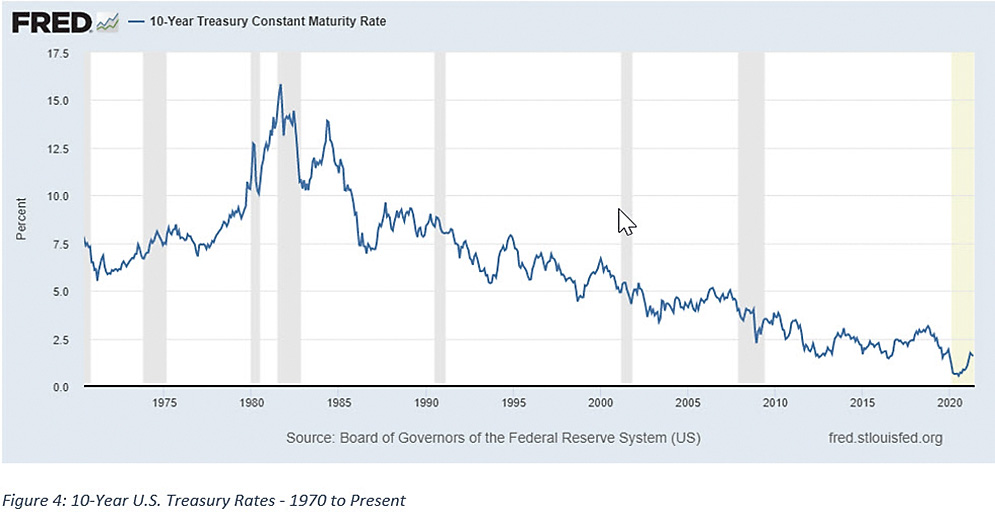
In the 1970s, the Fed ignored inflationary pressures until Paul Volcker became chairman and convinced the Fed to take aggressive, proactive action to address inflation concerns. Before that, the Fed’s policy was reactionary after actual inflation got “out of control.” Those of us old enough to remember this era can recall vividly how painful the results of those aggressive interest rate increases were, as demonstrated by Figures 3 and 4 below.
While a return to double-digit Prime and Treasury rates is not likely, it would still be challenging if rates rose rapidly. If a loss of confidence in the Fed to control inflation occurs, we could see a rate increase in the mid to upper single digits. As interest costs rise thanks to the large federal government debt load, tax hikes may follow. This seems likely thus far since our current elected leaders have shown little interest in reducing expenditures.
How Does This Impact Your Farm?
If your farm business is carrying a large term debt load on a variable rate, consider fixing some of that debt with an adjustable or long-term interest rate option to reduce your risk exposure to higher rates in the years ahead. While you might pay a little higher interest rate in the short-term, you will be protecting yourself from the potential risk of much higher rates down the road. Just like crop insurance mitigates your risk of a revenue shortfall, having at least some term debt on fixed rates mitigates your risk of higher interest expense. With so many factors out of your control, control what you can. We do indeed live in INTERESTing Times!
Source for all graphs: St. Louis Federal Reserve Bank FRED Economic Data
-
Tag Cloud
FreshRoots Land Classes Calendar contest land sales security Community Improvement Grants Focus on Farming calendar farmland auctions patronage 4-H Weather liquidity Land Values appraisals Farm Financials Education FOMC Essentials Newsletter FFA rural marketplace investment Weather Outlook Interest Rates cash flow Farm Credit College Auction Results