Farmland Value Benchmark Study Results

-
 August 9, 2022
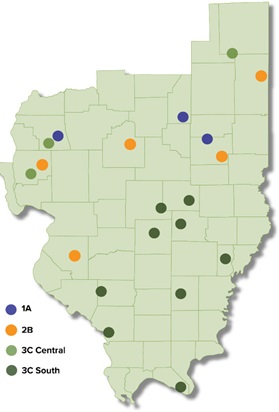
Each year the Farm Credit Illinois (FCI) appraisal team evaluates the same 20 benchmark farms throughout its 60-county territory based on the land’s productive index (PI) rating, as calculated by the University of Illinois’ Bulletin 811. Based on individual PI ratings, farms are divided into four categories: 1A, 2B, 3C Central, and 3C South.
Land Values Reach Historic Highs
Land values in the central and southern 60 counties of Illinois increased for the fourth consecutive year, according to the annual benchmark study. The year showed an active market with historic increases in several areas of FCI’s territory. On average, the benchmarks were up 27.88%.
2022 values have reached all-time highs in the FCI territory – by a considerable amount. As seen in Figure 1, land values had a dramatic run-up beginning in 2003, until peaking in 2014. The first decline in more than a decade began in 2015 and continued a slight decline through 2018. From that point, land values increased moderately for the next three years with 2022 results rising substantially and setting new highs.
Figure 1
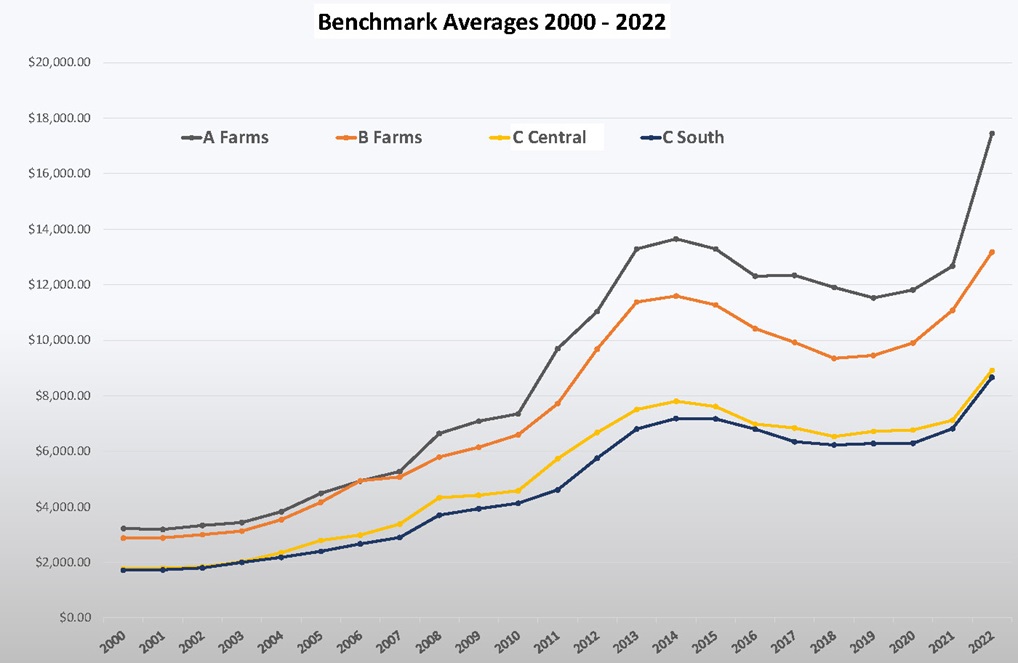
Figure 1: FCI’s average benchmark study results by land class on July 1, 2000-2022. Source: FCI 2022 farmland value benchmark study
The 2022 study reflected an increase of 27.88% with 19 of 20 benchmark farms increasing in value.
Results across all land classes showed considerable variation, reinforcing that agricultural real estate is a location-specific asset. When considering the individual benchmarks values, the year-over-year percentage changes ranged from +0% to +55.74%.
Table 1 illustrates the average changes in the four general land classifications. Class 1A and 2B benchmark farms are mostly located in central Illinois, whereas the Class 3C farms are located in both central and southern Illinois. These farms are tracked separately based upon their location. Benchmark farms are plotted and categorized by land class on the map to the left.
Table 1
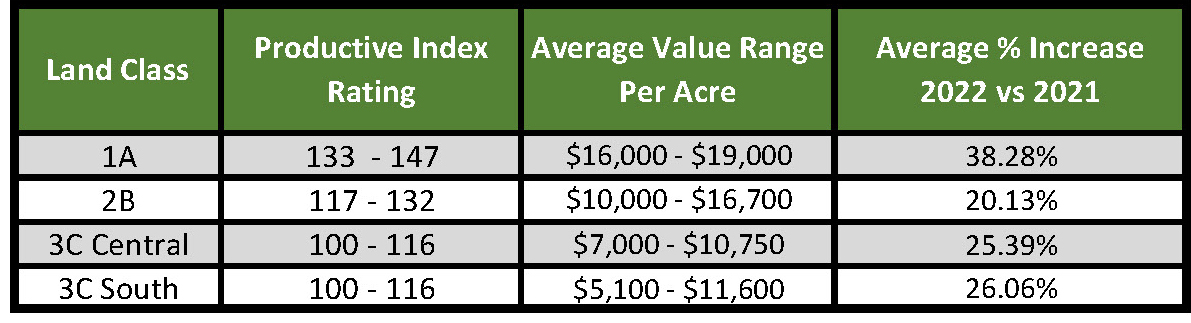
Table 1: Average percent change in overall value since 2021 by land class. Source: FCI 2022 farmland value benchmark study
Commodity Prices in Relation to Land Values
Higher commodity prices helped fuel the dramatic increase in land values from 2009-2014, and lower commodity prices lead to declining values from 2015-2018. Commodity prices remain a factor in the continued increase in 2022 farmland values. Figures 2 and 3 demonstrate the relationship between land values and corn and soybean prices.
Figure 2
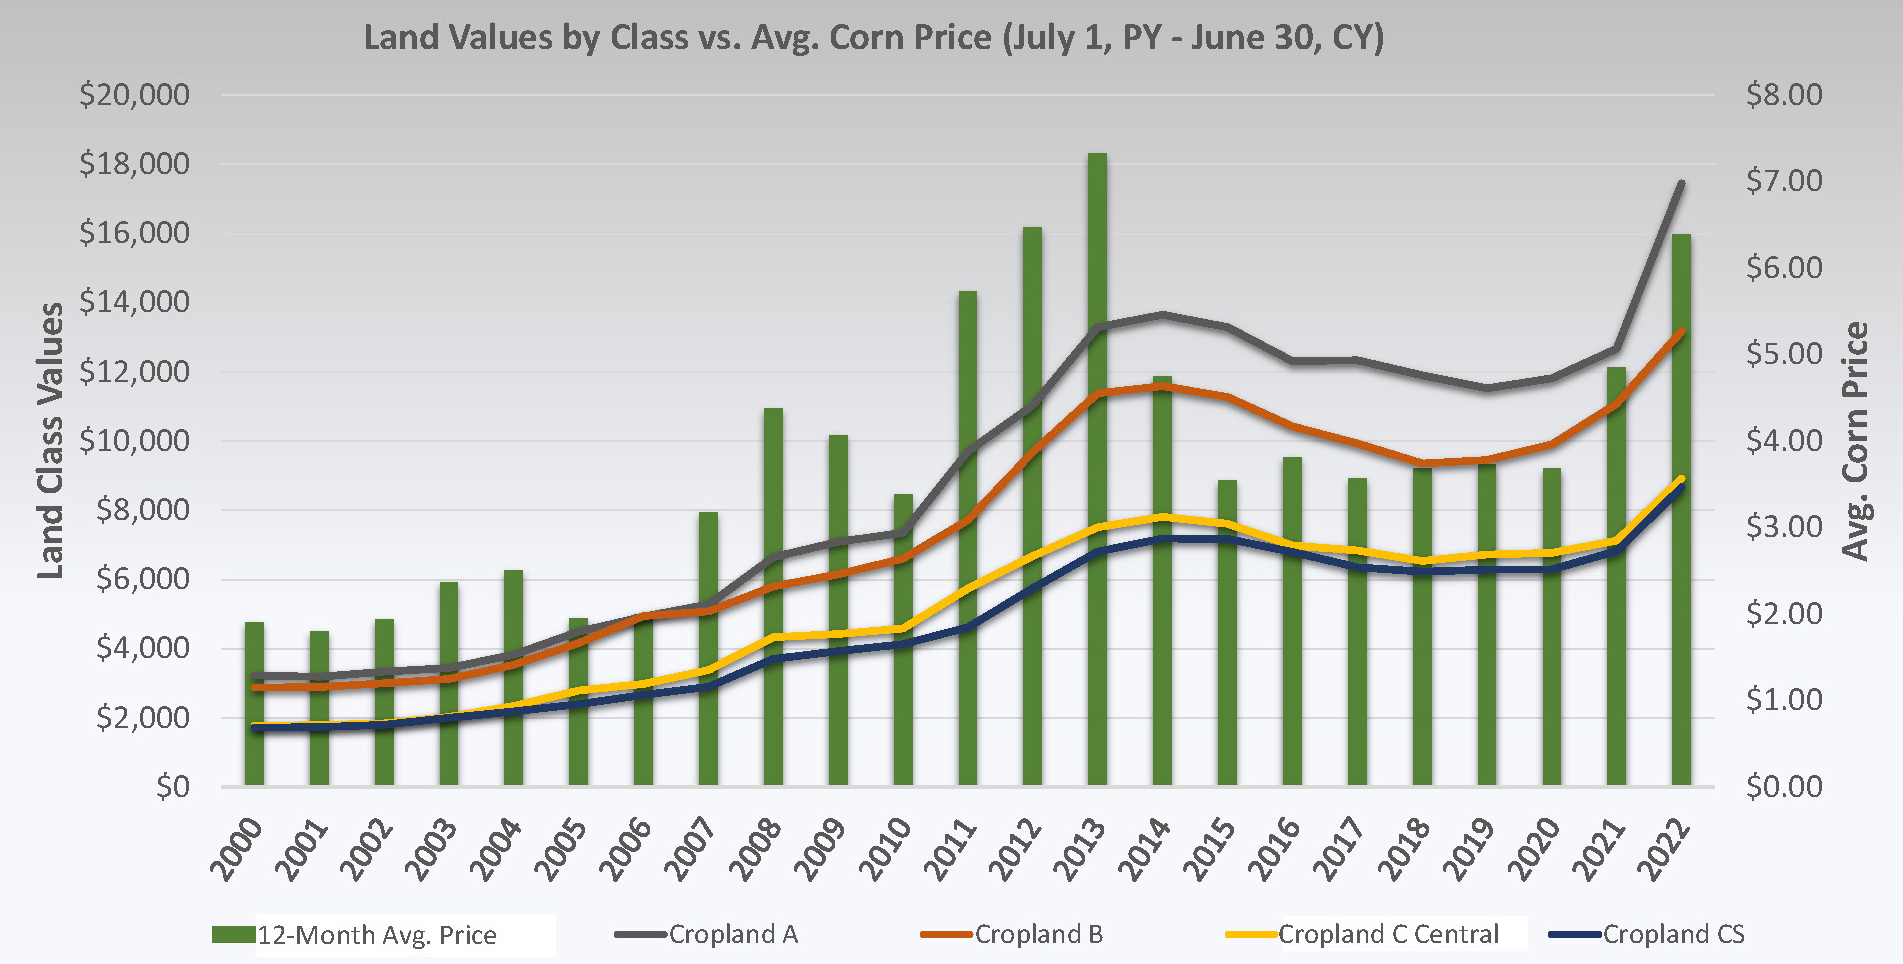
Figure 3
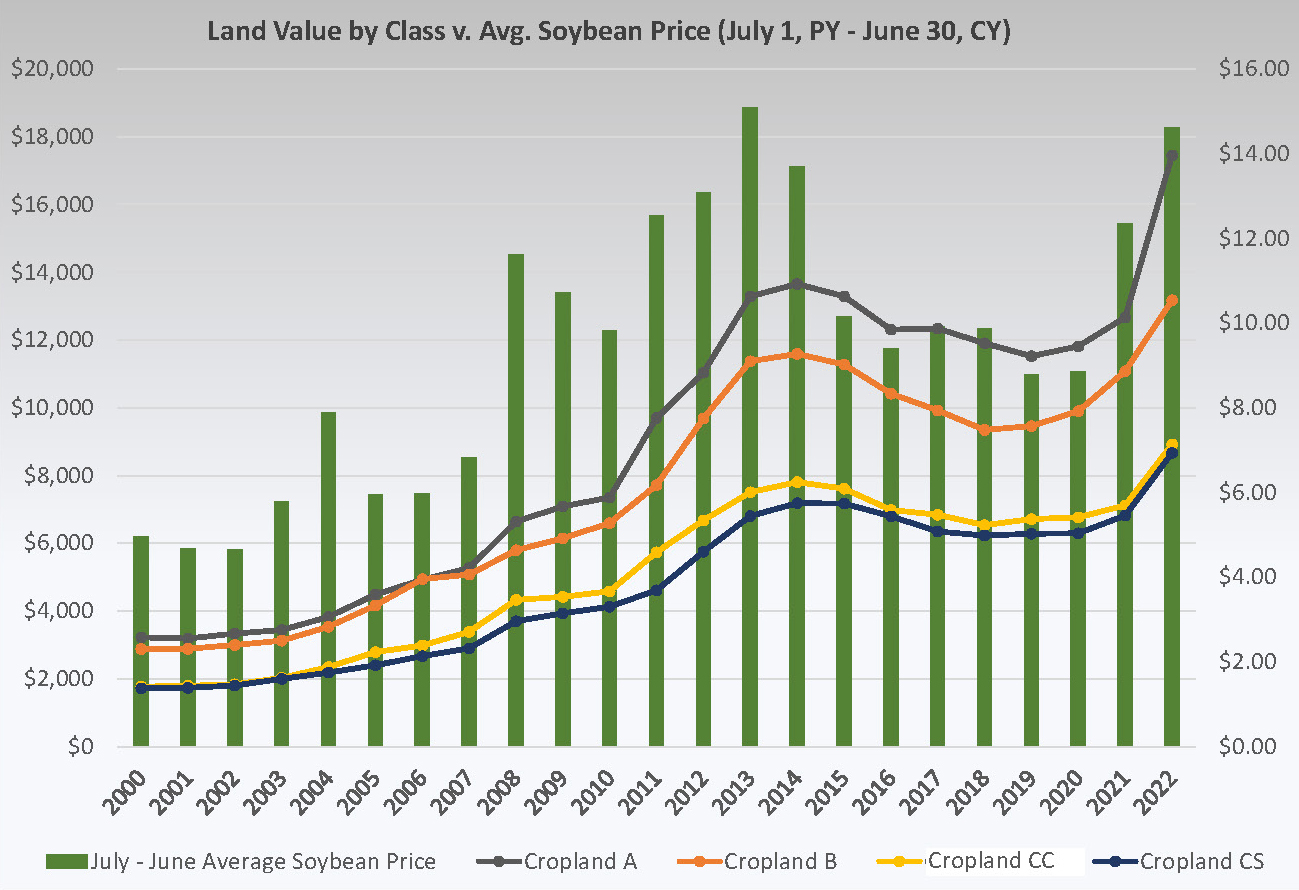
Figures 2 and 3: Average corn and soybean price in relation to FCI annual benchmark study results by land class annually on July 1, 2000-2022. Sources: Macrotrends.net and FCI 2022 farmland value benchmark study
Other Factors Affecting Land Values
A primary factor in the high land values continues to be strong demand for Illinois farmland with a limited supply of farms for sale. Buyers are a mix of operating and retired farmers, experienced farmland investors with ties to the area, and some outside investors. As stated above, commodity prices continue to be high.
In the past few years there have been Market Facilitation Payments – along with coronavirus assistance programs from the federal government like the Paycheck Protection Program – that helped stabilize balance sheets, increase working capital, and create a more positive outlook in agriculture.
Rising interest rates have not yet affected farmland values. If rates follow projected increases, however, they could bring down 2023 values.
Crop conditions throughout the FCI territory are mostly positive. Illinois corn conditions reported Aug. 7, 2022, by the USDA show 21% Excellent, 54% Good, 20% Fair, 4% Poor, and 1% Very Poor. Soybeans are rated at 20% Excellent, 50% Good, 26% Fair, 3% Poor, and 1% Very Poor.
Cash Rental Trends
Cash rents have followed suit and continue to increase. As illustrated in Table 2, average changes in the four land classes varied. In conducting the benchmark study, the rates used looked at the overall picture from the past year and looking forward into cash rents that will be negotiated this fall. Overall, cash rents are trending higher.
Table 2
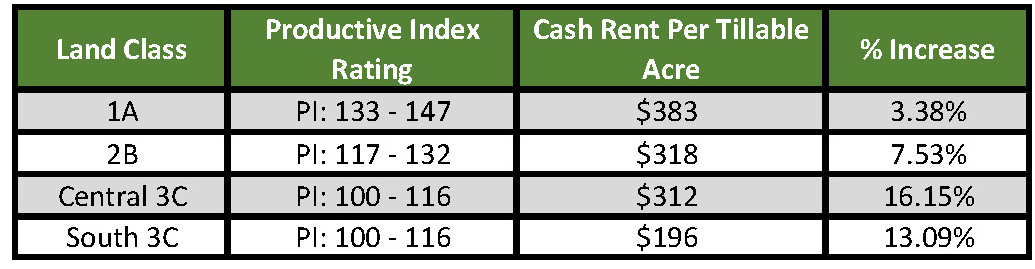
Table 2: Average percent change in overall cash rent since 2021 by land class. Source: FCI 2022 farmland value benchmark study
Summary
The 2022 benchmark update for the Farm Credit Illinois territory shows a booming land market. Nineteen of the 20 benchmarks showed increases in value with only one benchmark farm remaining unchanged. The variability of increases in the FCI territory reinforce that agricultural land is a location specific asset.
The economic health of farmers and farm owners is mostly stable, but there are still pressures on farmers’ financial positions. Higher input prices including anhydrous, rising cash rents, increasing machinery costs, and interest rate hikes will be a challenge for the upcoming year.
Overall, an increase of 27.88% indicates a robust market throughout FCI’s 60-county territory. Values for 2022 have surpassed all-time highs of 2014.
-
Tag Cloud
Auction Results Focus on Farming calendar Essentials Newsletter Farm Interest Rates security 4-H Weather Weather Outlook FOMC patronage liquidity cash flow Calendar contest Financials rural marketplace investment Land Values farmland auctions Farm Credit College FreshRoots land sales Land Classes Community Improvement Grants Education appraisals FFA