The Start of the 2018 Growing Season

-
 June 4, 2018

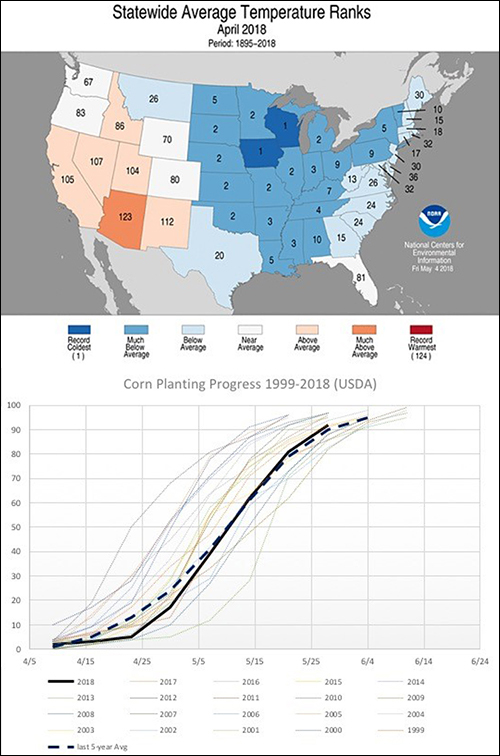
- Figure 1. (Top) Statewide average temperature ranks for April 2018. Source: Climate Prediction Center. (Bottom) 2018 U.S. corn planting progress; solid black line is 2018’s corn planting progress, dashed black line is the 5-year average corn planting progress. Source: USDA (created by Snodgrass)
Many across the state felt as though spring never arrived since May came in with some serious heat. Illinois corn and beans utilized the faster-than-normal accumulation of Growing Degree Days (GDDs) as temperatures were more like mid-summer than mid-spring. Rainfall became an issue for some across the state, especially across central Illinois along I-72, but timely rains in western Illinois followed by Tropical Depression Alberto gave the eastern side of the state a much-needed drink. As of June 4, Illinois is drought-free according to the U.S. Drought Monitor and the Illinois corn crop rating pushed passed 80 percent Good to Excellent in the late May USDA report. The very quick early accumulation of GDDs will result in an earlier pollination period that will start during the first week of July for most Illinois corn fields. In contrast, northern Iowa, Minnesota, and the Dakotas will start significantly later in the month. Looking closer at Figure 2, we can see that due to the hit-or-miss nature of May’s thunderstorms, there are pockets of below normal rainfall in Illinois, Iowa, Missouri, and Indiana that must be watched over the coming weeks.

- Figure 2. (Top) May 2018 Growing Degree Day anomalies using a base temperature of 50F.Source: PRISM data (created by Snodgrass). (Bottom) 30-day Precipitation Anomalies in percent of normal May 3, 2018-June 3, 2018. Source: AHPS (created by Snodgrass)
Short-Term Forecast – June 4-20, 2018
Four years of great summer weather has allowed Illinois to set record yield numbers. Weather has played a huge part in Illinois’ large crop production recently, mostly due to a favorable jet stream flow pattern July-August. The last 70 years of weather data, when correlated against yield, paints a very consistent picture – ridging in the jet stream extending from eastern Texas through Minnesota causes drought and excessive heat, while a westward shift in the ridge provides for great upper-level support for thunderstorm activity and less intense heat during pollination and grain fill. Years 2014, 2016, and 2017 all favored a ridge that was far to the west of Illinois in July and August, and therefore watching the June pattern set up will be crucial for the health of the 2018 crop.
Figure 2 (Top) clearly shows the warm bias of May. The big questions to ask are whether this pattern will continue, and will regular thunderstorm activity bring adequate moisture throughout the summer months? June 5-15 will feature above-average temperatures for the Central Plains as a ridge develops over Texas. Figure 3 (Top) shows temperature anomalies forecast by the GFS-Ensemble model for June 5-15 and the greatest deviations from normal stretch through the Great Plains. The ridge forecast to occupy the same region will have quite a bit of moisture building northward along its eastern side, which is very supportive of thunderstorm development. Figure 3 (Bottom) shows how much of the Corn Belt could favor “ridge riding” storms through the first half of June. The issue is that these storms tend to move quickly, cause straight-line wind damage, hail damage, and not every field will be hit by one. Therefore, closely monitoring recent precipitation maps will be crucial to assessing trouble spots by the end of the month.

- Figure 3. (Top) GFS-Ensemble temperature anomaly forecast June 5-15 (red = warmer than average, blue = cooler than average). (Bottom) GFS-Ensemble precipitation anomaly forecast for June 5-15. (greens = wetter than average, yellows = drier than average).Source: NCEP (created by Snodgrass)
Assessing the Central U.S. Drought & Watching the Pacific Ocean
Drought has survived May rains in the south-central and southwest U.S. and historically, drought in this region has led to hotter and drier summers in the Corn Belt – especially the western Corn Belt. Figure 4 shows the weather patterns for June-August during the top 13 driest March-August in the central U.S. since 1948. Very dry years in the south-central U.S. typically create very hot summers in the Central Plains as the drought expands east. Illinois typically experienced above-average temperatures and below-average rainfall when drought sets up in the south during spring, which led seven of those 13 years to have significantly below average corn yields. It is important to note that drought in the Central Plains is not the only controlling factor on Illinois weather in summer, but if it controls the position of the ridge in July, then warmer and drier weather is highly probable.
However, another major player in Illinois summer weather patterns can be found off the west coast of the U.S. and Mexico. Drought and heat in Illinois are very strongly, negatively correlated with sea surface temperatures off the west coast of the U.S. and Mexico (Figure 5 (Top)). In our hottest and driest summers, a large region of cooler-than-average water spread toward the central Pacific from the Baja of California. Currently, the waters in this region are not colder than average, which in turn favors a westward progression of the jet stream ridge for July and August – a very favorable sign for Illinois agriculture – just like we saw in 2017 (Figure 5 (Bottom)). Adding to this, the sea surface temperatures in the main development region for hurricanes are anomalously cool to start summer which is out of phase with hot, dry summers in the Midwest. Finally, this summer will have an ENSO neutral (neither El Niño or La Niña) equatorial Pacific. Regardless, we must watch the position of the jet stream very closely over the next 90 days.

- Figure 4. Analysis of the June-August weather patterns during the 13 driest years in the south-central U.S. (Left) 700 mb height pattern showing a ridge in the central U.S. during June-August. (Center) Surface air temperature anomalies during June-August. (Right) Precipitation rate anomalies during June-August. Source: CPC/ESRL (maps created by Snodgrass)

- Figure 5 (Top) Correlation between jet stream ridging and above average temperatures in the Midwest with global surface temperature and sea surface temperatures. (Bottom) May 31, 2018, global sea surface temperature anomalies. Source: NOAA
Long Range Forecast for June-July-August
The best long-range guidance for June-August 2018 forecasts the largest temperature anomalies to be focused in the Central Plains from Texas through the Dakotas and Montana. A secondary region of well-above-average temperatures may extend over to the Pacific Northwest. Illinois is forecast to have above-average temperatures, but the warmest anomalies are currently forecast to set up west of Illinois. Summer precipitation forecasting is very challenging more than 7-10 days into the future. Pay very close attention to the position of the ridge this summer – the farther west it establishes, the better for Illinois crops. There will be times during June, July, and August that the ridge migrates east and sets up over Illinois, bringing in the high 90s and potentially dry conditions. However, longer-term trends plus analog and dynamical model support suggest Illinois does not see the worst of the summer weather this year. The greatest wildcard is the Central Plains drought which is why I have medium- to medium/low-confidence in this long-range forecast.

- Figure 6. June-August temperature and precipitation forecast from the ECMWF 51-Member Ensemble Model.Source: European Center for Medium Range Forecasts
-
Tag Cloud
farmland auctions Farm Credit College 4-H Farm appraisals liquidity FOMC Interest Rates Focus on Farming calendar grants land sales Land Classes rural marketplace investment Essentials Newsletter security Financials cash flow Auction Results patronage Education Weather Weather Outlook FFA Community Improvement Grants Calendar contest Land Values